3.7.6 Voltage time derivative
The time derivative was measured already in 1939 [43], see Fig. 3.12. However, its role has not yet been recognized. Interestingly, Cole and Curtis derived the AP by integrating the experimentally derived , essentially in the same way as we do. (they also discussed the widening/smearing effect of the measuring technology)
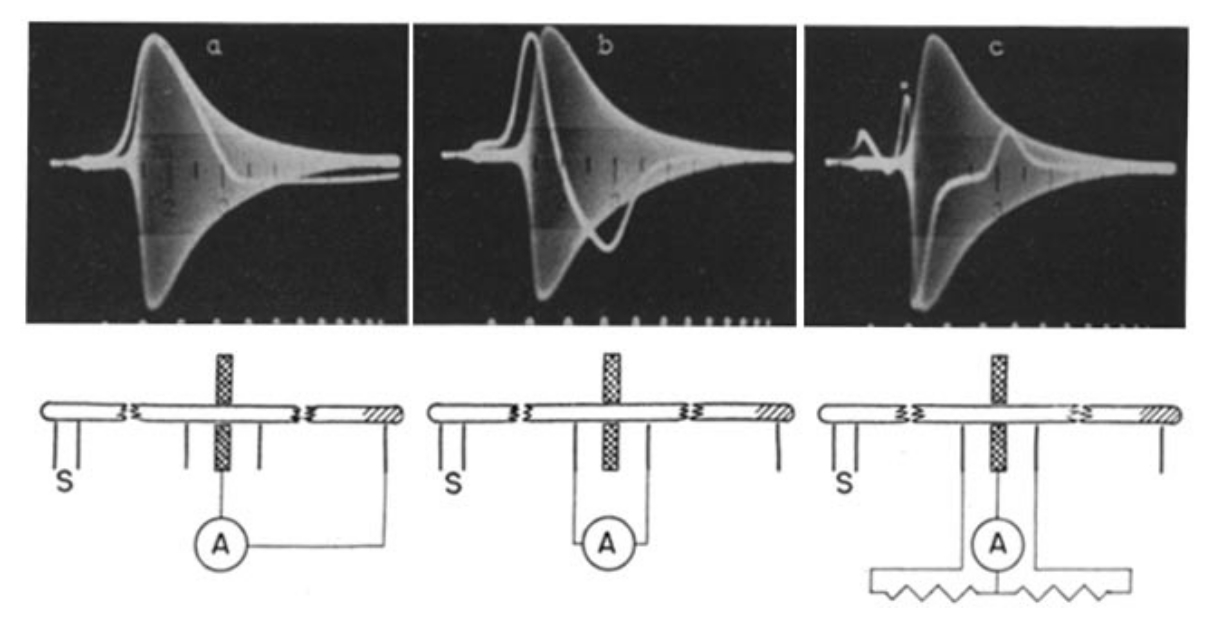
The shape and different parameters of AP has been the subject of numerous studies. For example, [117] measured AP, simultaneously with its time derivative of the APTD for a wealth of neuron types. Those measurements provide a direct proof for the existence of the APTD our theoretical approach introduced, see equations (3.6), (3.7), (3.5) and Figs. 3.13 and 3.11. However, notice that the causality is reversed. The current inflow through the neuron’s membrane generates APTD, and its time course generates AP through the circuit. Notice that the theoretical APTD is much sharper than the experimental one. Actually, the latter value is a differentia ratio (instead of differential quotient) from measured values. The measuring electrodes’s size defines the position (and time) difference. In the case of measuring a signal with very sharp form the two quotients differ significantly.
Fig. 3.14 shows how the rushed-in ions produce the AP. The blue diagram line describes how the AP depends on the voltage gradient. The life begins at coordinates (0,0), in the tiny orage circle, with exciting the neuron. The synaptic excitation is pulse like, so the voltage simply rises without a gradient being generated. When the membrane’s voltage threshold reached, the potential does not change, but the gradient jumps due to the (instant) appearance of the runshed-in ions, see the rightmost point. From this point on, the potential increases while the gradient decreases; the diagram line proceeds from right to left. The potential increases as the ions entering the surface layer at some point farther from the AIS: to travel such a distance, needs time. The highest point reached when the ions from the largest distance could reach the AIS. (The influx was instant, the charge will continuously decrease due to the current through the AIS. The change in the layer behaves as a high-viscosity charged fluid. The electric and thermodinamic driving forces propagate with enormously different speed, and the fluid must be contiguous; so the voltage temporally increases before the AIS (ram current or impact current), and the fluid turns back which means that the ion current changes its direction (condenser effect). Due to the decreasing current, the voltage starts to decrease, although the voltage gradient is still positive (it is the contribution of the rush-in current, only). The negative current continues and turns first the gradient to negative whihc turns the potential to negative (a state known as ’hyperpolarization’), and finally the relaxed current takes but the potential and the gradient back to zero (the resting potential).
The green dashed diagram line shows the AP in the function of the voltage measurable on the AIS (the difference of the gradients of the rush-in and the outflow gradients). This diagram line also starts from the orange circle, but since the excitation increases the potential that generates current (and so potential gradient) on the AIS, the gradient goes to negative as the potential increases. When the potential reaches the threshold value, the gradient jumps to its maximal positive value and the potential increase at a decreasing pace. It reaches its maximum value when the resulting gradient reaches zero. The negative gradient turns the potential even to negative (hyperpolarization) while approaching its zero driving force. (the outflow current decreases the gradient, so, the parabola gets asymmetric). The oscillator comprises one turning point; it is perfectly damped (to provide the fastest operating speed).